13/07/2014 The minimum number of triangles per draw call
RSS Feed ~ Comment: by email - on Twitter ~ Share: Twitter - Facebook - Linked In - Google+ - Permanent link
Graphics programmers use 'batching' as a common performance guide line. 'Batching' is often understood as regrouping multiple draw calls into a single draw call. This is supposed to imply that a draw call is expensive and by reducing the numbers of draw call we linearly increase the performance. This vision is not correct and it doesn't reflect how GPUs work.
Batching has a performance benefit essentially because of the regrouping of buffers and textures data into larger resources. What's expensive about a draw call is the possible driver validation that a draw call may trigger but validation will happen only if states have changed. By regrouping resources we can avoid as many driver validations.
In this post, we are looking at the GPU draw call performance. We are studying the minimum number of triangles per draw call that can be submitted before we reach a different and lower performing hardware bottleneck. We are working using a tight loop (a draw call loop without state changes) so that we are not triggering driver validations for each draw.
- for(std::size_t i = 0; i < VertexCount; i += 6 * this->TrianglePairPerTile / this->DrawPerTile)
- {
- glDrawArraysInstanced(GL_TRIANGLES,
- static_cast<GLint>(i),
- static_cast<GLsizei>(6 * this->TrianglePairPerTile / this->DrawPerTile),
- 1);
- }
Using a tight loop, we can slice the rendering of a mesh and add fine grain culling in the draw calls loop without triggering any driver work. As usual with culling, we are improving the GPU efficiency by avoiding GPU overhead of not visible triangles.
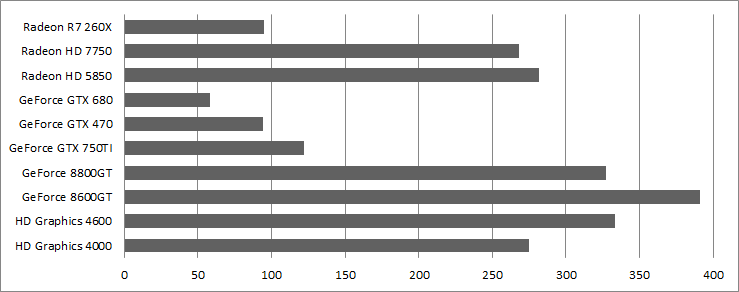
Minimum triangle count per draw call per graphics card
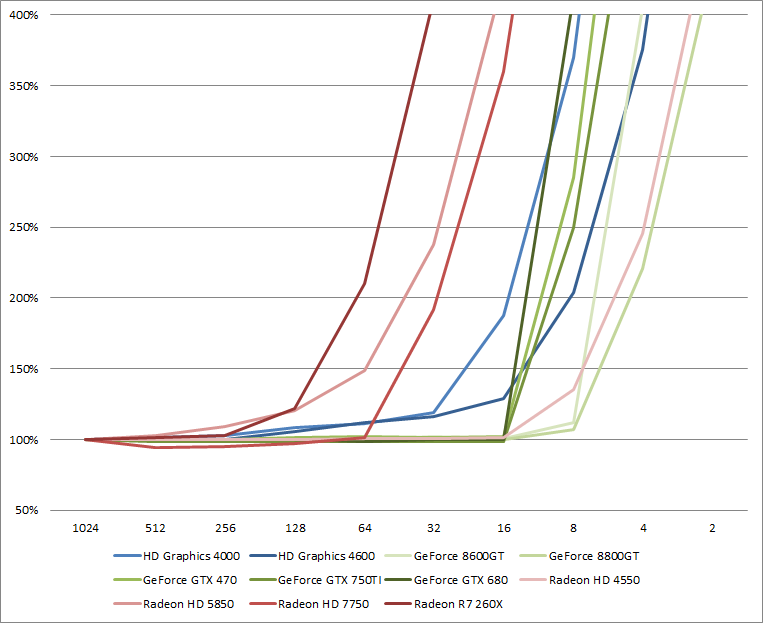
It is very important not to jump too quickly into conclusions with the previous graph. We should not compare the lines against each others as the given results are relative to each card.
First, the minimum number of triangles per draw on NVIDIA GPU is 16 triangles per draw since Fermi (GTX 470) and it was 8 triangles per draw on GeForce 8. Second on Intel, reducing the minimum number of triangles per draw start to have an impact from lower than 256 triangles per draw. However, the performance impact becomes significant only from 32 triangles per draw on Ivy Bridge (HD 4000) and 16 triangles per draw on Haswell (HD 4600). On AMD, at first it appears to be a little more random: 256 triangles per draw is a good number to keep in the back of the head but on HD 7750 we can go as far as 64 triangles per draw. On a HD 4550, it's 16 triangles per draw.
To make sure that we are not CPU bound, I made an experiment with the HD 4000, the R7 260X and the GTX 750 on an Ivy Bridge 3770K running at 2.8 GHz and 3.8 GHz. On both cases, I had the same performance results. In these tests, we are GPU bound somewhere.
Next we are having a closer look at the results using the absolute numbers per vendor as we can expect some correlation between GPU generations per vendor.
AMD architectures behavior against small triangle count per draw call
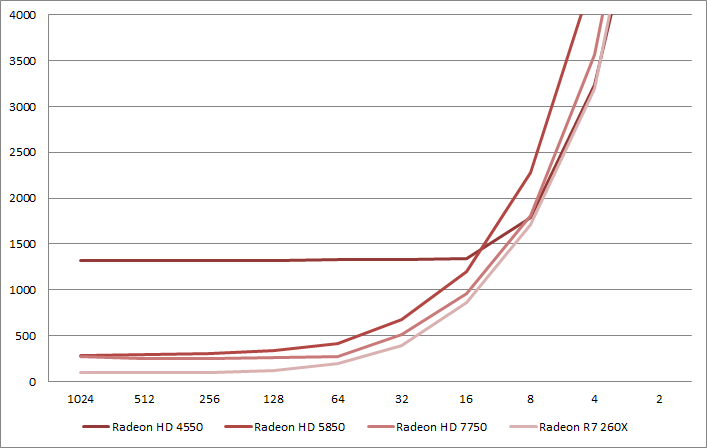
First, either AMD made significant hardware changes between the Radeon HD 4000 series to the Radeon HD 5000 series or we are observing a drivers bug. Either way, the effective draw call performance of the Radeon HD 4000 series is particularly bad even compared with the older GeForce 8 series.
The results between the Radeon HD 7750 and the Radeon R7 260X are particularly interesting. They follow nearly the same curve except that the R7 260X is faster. First, it can be partially explained by the fact that the HD 7750 is clocked at 800 MHz and the R7 260X is clocked at 1100 MHz which is a 137% relative different in frequency. Interestingly, this performance difference is the same difference we observe between the two chips at 32 and 64 triangles per draw. Then, between 16 to 2 triangles per draw, the performance gap is reducing which either means that we are under-utilizing a parallelized hardware block which might be the same or a different one than in the 32 to 64 range. Finally, the range between 128 to 1024 shows a nearly constant performance difference of 265% between the cards that is twice 137%. This can be explained by an architecture difference: The Radeon HD 7750 (S.I. Verde) produces 1 triangle per clock where the Radeon R7 260X (C.I. Bonaire) produces 2 triangles per clock.
We can conclude that on Bonaire, Pitcain and Tahiti, chips that all supports 2 triangles per clock, we can benefit of the higher primitive rate only if we submit more triangles per draw. Hawaii supports 4 triangles per clock but it's a V.I. chip so hopefully AMD fixed that behavior in the hardware design. Unfortunately, I don't have access to a Hawaii chip.
AMD has significantly improved the primitive rate on its GPUs, however they haven't changed sibling blocks which results in pretty bad triangles per draw performance compared with other desktop vendors.
We can reach the primitive rate on AMD architectures from 256 triangles per draw call as a worse case.
NVIDIA architectures behavior against small triangle count per draw call
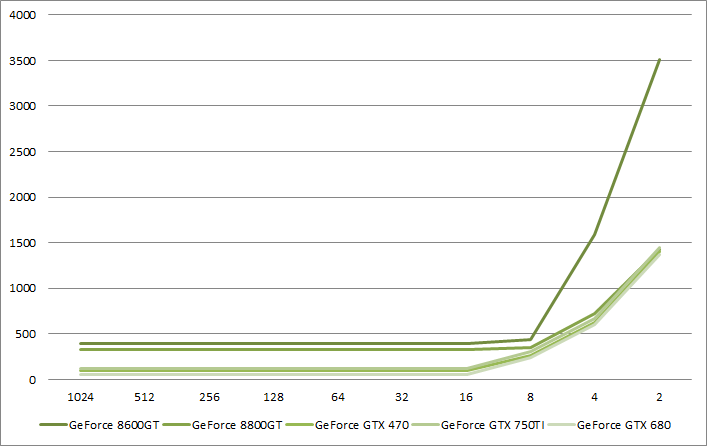
When it comes to draw call performance, NVIDIA GPUs are very pleasing. 16 triangles per draw is just fine. On old GeForce 8 architecture, 8 triangles per draw is fine too but this might only be because the primitive rate was a lot lower than on current hardware. Just like for AMD GPUs, we observe the convergence of performance between GPUs when the triangles per draw call count is getting too small.
The performance from 16 to 1024 triangles per draw can be explained by the primitive rate performance of each GPU: 4 triangles per cycle on the GTX 680 and 1.67 triangles per cycle on the GTX 750. I haven't find a source for it, however it seems that the GeForce GTX 470 supports 2 triangles per cycle. It looks like the GeForce 8 was capable of less than a triangle per clock, probably 0.5 triangle per clock on the GeForce 8800 GT.
We can reach the primitive rate on NVIDIA architectures from 16 triangles per draw call on all GPUs.
Intel architectures behavior against small triangle count per draw call
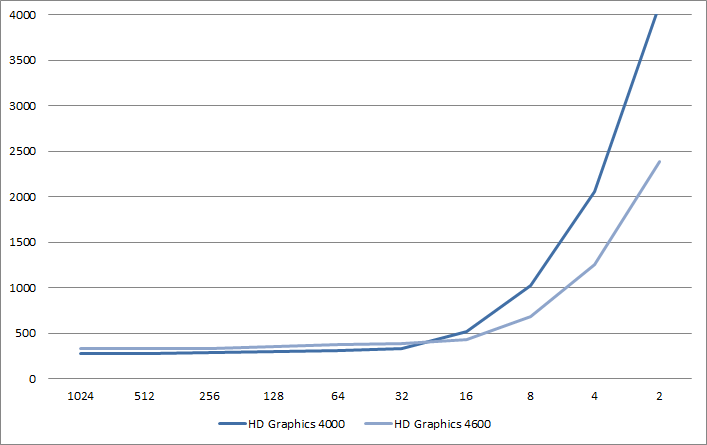
Intel GPUs primitive rate performance are pretty low despite Ivy Bridge being clocked at 1150 MHz and Haswell being clocked at 1250 MHz. It looks like that Haswell primitive rate is lower than Ivy Bridge so that I expect that the primitive rates for Ivy Bridge and Haswell is respectively 0.5 and 0.33.
The lower primitive rate performance of Haswell compared with Ivy Bridge remains quite suspicious to me. This could be a case where the GPU is not running full speed because the performance states haven't been triggered for it. Without any feedback in the OpenGL API to detect these cases, I can't confirm or not this hypothesis.
The primitive rate is pretty bad but it looks like that some hardware blocks have been improved as Haswell is more efficient for low triangles counts per draw case than Ivy Bridge.
We can reach the primitive rate on Intel architectures from 32 triangles per draw call as a worse case. On Haswell, we can use 16 triangles per draw call.
Conclusions
- 32 triangles per draw on Intel architectures
- 16 triangles per draw on NVIDIA architectures
- 256 triangles per draw on AMD architectures
On my previous study on small triangles, I concluded that a good target per triangle is to cover at least 8 by 8 pixels. Thanks to the results on the minimum number of triangles per draw and the minimum number of pixels per draw, we can conclude on the minimum tile size that a draw needs to cover. This could be useful to do efficient coherent screenspace rendering.
- 64*32 tiles per draw on Intel architectures
- 32*32 tiles per draw on NVIDIA architectures
- 128*128 tiles per draw on AMD architectures
Finally, we can visualize the primitive rate performance and compare these results between GPUs.
The source for these tests (test_draw_call) in available in the master branch staging of the OpenGL Samples Pack in the 'micro' project.